I wanted to use data from GitHub maintained by the Washington Post to model whether or not certain races are more likely to be killed by police officers when fatal shootings occur. If so, what factors go into why this is? The relevant data contained information about the time and place of the 3,639 fatal police shootings since the beginning of 2015. It also contained info about the suspects, such as their names and ages, whether or not they were carrying weapons and what weapon they were carrying (the list of weapons includes guns, knives, swords, crossbows, spears, fireworks, bayonets, and more), whether or not the suspect was fleeing and how, the threat level of the suspect (attacking, not attacking, undetermined), whether or not the suspect exhibited signs of mental illness, and of course, the race of the suspect (white, black, Hispanic, Asian, Native American, other, or unknown). It also contained information about whether or not the officer was wearing an active body camera at the time of the shooting.
Inside the Numbers
Taking a look at the data, whites were most often killed by police in the timeframe provided. On average, from 2015 to 2017, 472 whites, 235 blacks, and 167 Hispanics were killed by police per year.

But in a country that is 72.4% white according to the 2010 National Census, perhaps that is to be expected. What would be interesting is to adjust the numbers in the data by the percentage that each demographic comprises in the country. So, that's what I did, but there was one difficult part to this--what to do with the "unknown" race in the data.
I determined that the observations with an unknown race could be dropped as they appeared to be distributed randomly in the dataset. Their average ages as well as the weapons they used, the threats they posed, the states their incidents occurred in, etc. appeared to be close to the averages in the data overall. The assumption that I had to make to justify this decision was that the "unknown" race was just as likely to be white, black, Hispanic, etc. as any other observation. Perhaps that is an assumption worthy of criticism (I could imagine an argument being made that the race of a white person killed is more likely to be identified and made available publicly due to the majority status of whites so that the unknown race observations are more likely to be of minority persuasion), but it was the assumption I deemed best. After dropping these observations, as well as some observations in which age was unknown, I was left with 3,238 data points to work with.
Race
|
Number
times in dataset
|
Percent
of Total in Data
|
Natl
Avg
|
Ratio:
Perc in Data to Natl Avg
|
Asian
|
54
|
1.67%
|
4.80%
|
34.74%
|
Black
|
825
|
25.48%
|
12.60%
|
202.21%
|
Hispanic
|
592
|
18.28%
|
16.30%
|
112.16%
|
Native Amer
|
57
|
1.76%
|
0.90%
|
195.59%
|
Other
|
34
|
1.05%
|
9.30%
|
11.29%
|
White
|
1676
|
51.76%
|
72.40%
|
71.49%
|
In the table above, the last column gives the percent of each race in the dataset over the percent that particular race makes up of the U.S. as a percent ratio. This means, in practical terms, Asians are 34.74% as likely to be killed by police as we would expect based on the percentage demographic they make up all together in the country and blacks are 202.21% (2 times) more likely based on their percentage. Whites are 71.49% as likely and the other two minority races, Hispanics and Native Americans, are also more likely to have been killed than we would expect by just looking at the percentage of the country's demographic they make up. This seems to confirm what many have contended: given a fatal police shooting has occurred, the suspect is more likely to have been of minority racial persuasion after adjusting for national demographic differences. This does not hold true for the Asian and "other" categories, however.
The next step was determining if I could model the data mathematically to flesh out more insights and how I would do so. I decided to use a logistic regression with two classes (specifically, a Logit model seemed to fit the data best). This required dividing each observation into one of two types and using the other factors recorded in the data to predict if any given observation was one type or another based on the other characteristics. I would then compare my predictions with the actual data to determine how well such modeling works. This is a relatively simple approach that eschews some of the more complicated machine learning techniques that I did not deem necessary for the issue at hand. If I found a model which was better than simply guessing, I could measure the statistical significance of the inputs and use them to explain why certain races are more likely to experience a fatal police shootings than other races.
I decided to divide each observation by a grouping of races of the individuals killed. I wrestled with how this would best be done, and in the end, determined to group by whether or not the suspect was white/Asian or black/Hispanic/Native American/other. I used the information displayed in the table above to help inform this decision, but I also looked at a summary of the data broken down by race to determine which observations were most similar to each other. As well, I used common intuitions to inform this process, and in the end, determined that the split given above made the most sense.
Logistic Modeling and Bias
Using the following inputs:
- Age of suspect
- The state the shooting occurred in
- Whether the suspect was just shot or shot and tasered
- The kind of weapon used
- if the suspect was armed with a ranged weapon (gun, crossbow, etc.)
- If the suspect was using his/her car as a weapon
- If the suspect was not using a weapon
- If the suspect was using a non-ranged weapon
- If the suspect was using a toy weapon
- Whether the suspect displayed signs of mental illness
- Whether the threat level of the suspect was known by officers
- Wheather the suspect was attacking the officer(s)
- Whether the suspect was fleeing
- If the officer was wearing an active body camera
- The gender of the suspect
I wrote a model to determine if I could answer the question at hand. At first, this model gave strange output, and I could not figure out why. Many of the estimations were giving highly non-intuitive results, with states showing dramatically different levels of significance and magnitude in ways one would not expect.
I soon realized that the states with the highest percentage of minorities were also the states most likely to see suspects killed who were black, Hispanic, Native American, or other. This gave a hint that I was not actually capturing any differences across states, but rather, differences in state demographics.
To control for this and "unbias" the models, I took data from the Census Scope online and added it to the model. The code on R I used to scrape this data is given below:
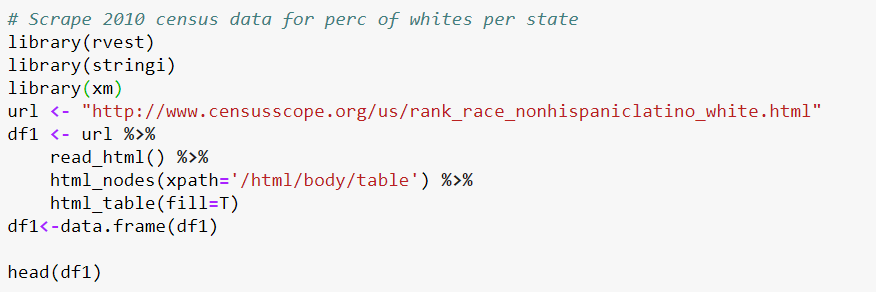

Specifically, I used the percentage of whites in each state to control for demographic differences across the country. Since this data is old and does not account for the percentage of Asians in each state, perhaps there is a better way to control for such demographic differences, but I figured this would be good enough for my purposes. What doesn't matter is that the numbers are exactly correct, but rather, that the variation across states derived from the older dates is consistent with current data. I therefore imagine the better ways of doing this would not make a significant difference in final results, but it definitely would require a lot more work.
I then reran the models and discovered that all data pertaining to states became insignificant after controlling for demographic differences. This means I found no evidence that one's race makes a difference in any given state vs. another when it comes to this issue. I therefore decided to drop state-related variables and focus only on the other factors in the model. This left the model with 14 inputs that I used to predict 1 output--the race group of the individual killed. In the matrix below, we can see how each of these factors correlate with one another ("race_BHNO" meaning whether or not the suspect was black, Hispanic, Native American, or other; "MI_signs" being whether the suspect exhibited signs of mental illness).

For a complete look at each of the variables in the final model, as well as summary statistics, see here.
Model Results
The significant factors determined to be highly indicative of one's race in the model were:
- The percentage of whites in the given state of the shootings (for reasons already covered)
- The age of the suspect
- Whether the suspect displayed signs of mental illness
- Whether the officer was wearing an active body camera
- The gender of the suspect
- Whether or not the suspect was carrying a "toy weapon"

Returning to the model output, the "intercept" was also very high in the positive direction, meaning that suspects killed by police were much more likely to be black, Hispanic, Native American, or "other race" for reasons not accounted for in the model. We cannot explain why that is by just using the data at hand. The factors that are controlled for in the model, however, have interesting interpretations. If the assumption holds that there are not other factors that significantly affect both the inputs and output of the model, we can use the following interpretations of the statistically significant model estimates to inform our understanding of this subject:
- Percentage of whites in state: As the percentage of non-white people increases per state, the proportion of blacks, Hispanics, Native Americans, and "other race" killed by police increases almost exactly proportionally
- Age: The younger one is when fatally shot by police, the more likely that individual is to be black, Hispanic, Native American, or "other race"
- Signs of mental illness: If the suspect killed by police has exhibited signs of mental illness, he or she is about 49% more likely to have been white or Asian
- Active body camera: If the officer is wearing an active body camera, he/she is 38% more likely to have killed a black, Hispanic, Native American, or "other race" suspect
- Gender: If the suspect killed was male, he was about 50% more likely to have been black, Hispanic, Native American, or "other race"
- Toy weapon: If the suspect killed was brandishing a toy weapon, he/she was about 36% more likely to have been white or Asian
Conclusion
Using the data maintained by the Washington Post, I determined that given a fatal police shooting has occurred against a criminal suspect, blacks, Hispanics, and Native Americans are far more likely to have been the ones killed when adjusting for demographic differences in the country. I also determined that age, signs of mental illness, and gender of the suspect are some of the most significant factors in determining this. For a look at the model output, interpretations, accuracy metrics, summary statistics broken down by race, list of weapons, and other information, see here. For a look at the Rscript I used in performing this analysis, see here. Please leave comments if you feel so inclined about what could have been done to make this analysis better, what you liked, etc.
No comments:
Post a Comment